PedDesign
At CSDILA, we harness the power of land administration, geospatial information, and land intelligence to create solutions for a more sustainable, resilient, and connected world. Our research pushes boundaries—transforming the way we govern land, plan cities, manage risk, and shape the built and natural environments. Each of our Research Impact Areas demonstrates how innovative spatial thinking can deliver tangible benefits for communities, industry, and governments worldwide.
Find out about our strategic and major research projects
Industry Collaborative Project
2020-2021
Overview
With the new normal shaped by COVID-19, spatial information can no longer be neglected. No matter the location and the occupation, people tend to interact with each other spatially and temporally. The understanding of how people move and interact is only more crucial in the design and operation of infrastructure.
Given that the prevalent way of tracking COVID is still through contact tracing when someone has been infected, we want to be more precautious by knowing how infrastructure design and layout can impact people’s movement and predicting the risks of virus transmission using data analysis methods. With this foresight, CSDILA started our collaboration with ARUP to provide the PedDesign tool in our Digital Twin to enable this insight in depth.
ARUP’s pioneering crowd simulation software MassMotion provided us with the simulated people movement data. Our team then developed different levels of analysis models and presented in our Digital Twin to assist the design and operation of infrastructure with the consideration of physical distancing parameters.
Capabilities
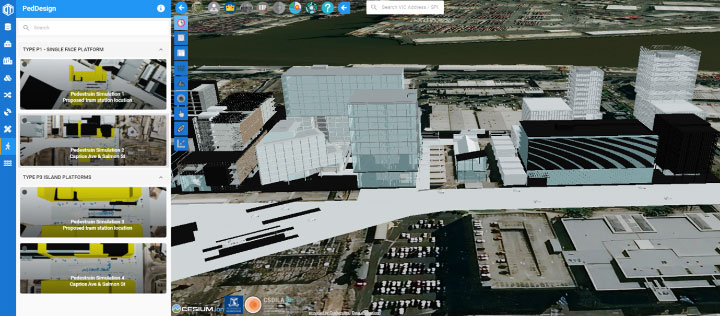
The design of the new tram stops and entrances to the University of Melbourne’s Fishermans Bend campus have been selected to test the concept and technology. Specifically, four scenarios are implemented with the following capabilities:
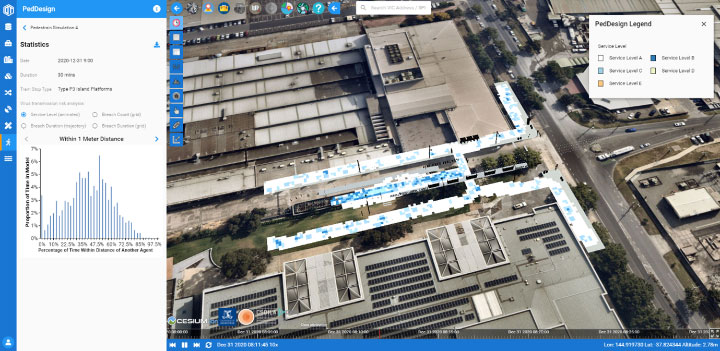
- Service Level Analysis: Presents the density of pedestrian movement for selected areas and periods, and users can view the level of services through a time-dynamic graphical scene.
- Breach Count Analysis: Individual interactions between pedestrians are weighted by physical distance and visualised in colour-coded space.
- Breach Duration Trajectory Analysis: Captures and visualises the trajectories of continuous breaches where pedestrians are paired with each other within a certain distance.
- Breach Duration Grid Analysis: Continuous trajectories are aggregated to units of space to indicate where in the space continuous exposures are more likely to occur.
- Statistics and charts: Various analytics are provided to help users analyse the data from different perspectives, such as temporal trends and correlations.